Travel Itineraries and more
Explore the Self Drive Way:
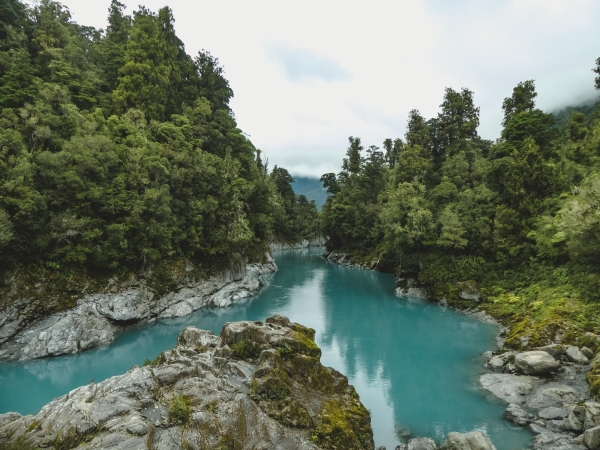
Coromandel Peninsula Loop
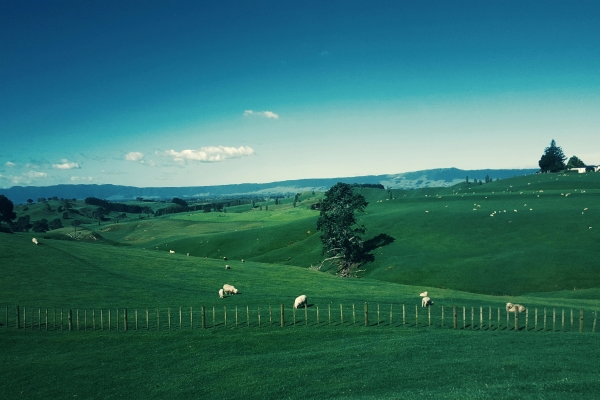
Depart from Auckland and circle the Coromandel Peninsula, renowned for its beautiful beaches, lush rainforests, and the famous Cathedral Cove. Return to Auckland after exploring the peninsula’s natural wonders.
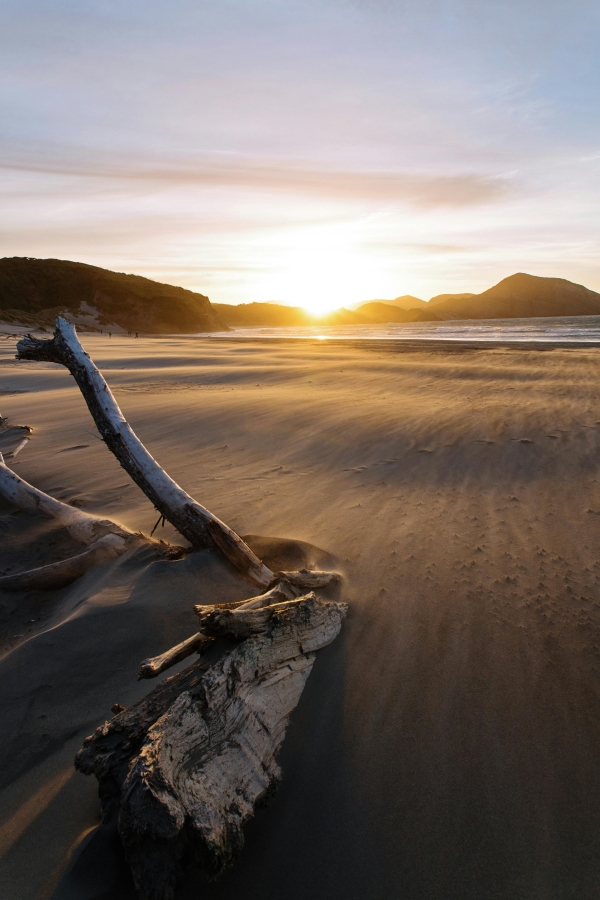
Nelson to Golden Bay
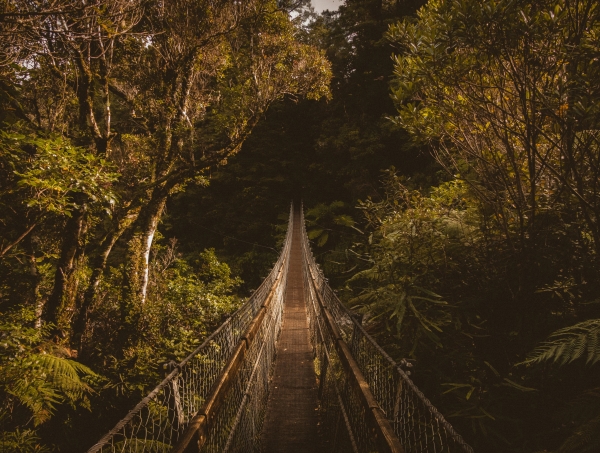
Start your journey in Nelson, known for its vibrant arts scene and beautiful beaches. Continue to Golden Bay, where you can explore the Farewell Spit, a nature reserve home to many bird species, and the crystal-clear waters of Te Waikoropupu Springs.
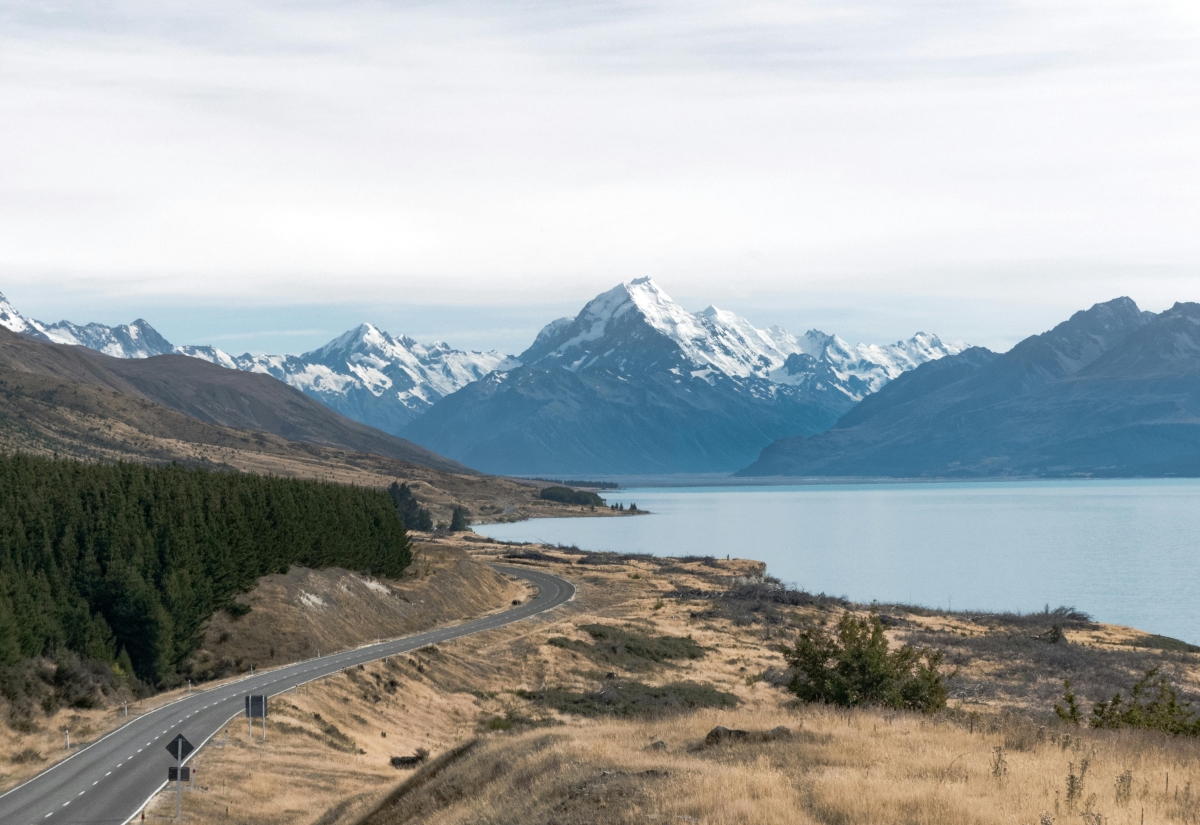
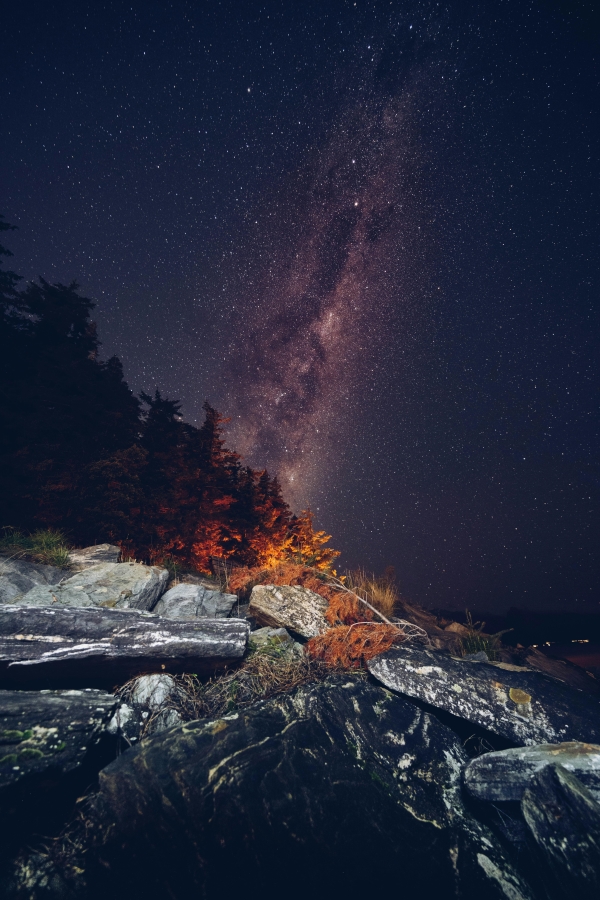
Lake Tekapo to Mount Cook
Begin in the tranquil town of Lake Tekapo, famous for its turquoise lake and the Church of the Good Shepherd. Enjoy stargazing in the International Dark Sky Reserve.